
Report #3:
Community Economic Development Organizations, Geography & Financial Resources
Community Economic Development Organizations, Geography & Financial Resources is the third report in the Money Meet Community series. It analyzes how resources and community development organizations are distributed across the United States. This report answers a few basic questions:
- How are different kinds of community development organizations distributed across U.S. regions and between metropolitan and non-metropolitan areas?
- Do some regions appear more hospitable to community development organizations than others when you look at the numbers of groups, revenue flows, government grant support, and total assets?
- Are urban areas more favorable than rural areas in terms of funding for community development organizations?
Our goal is to use research data to identify opportunities for the community economic development field.
Findings
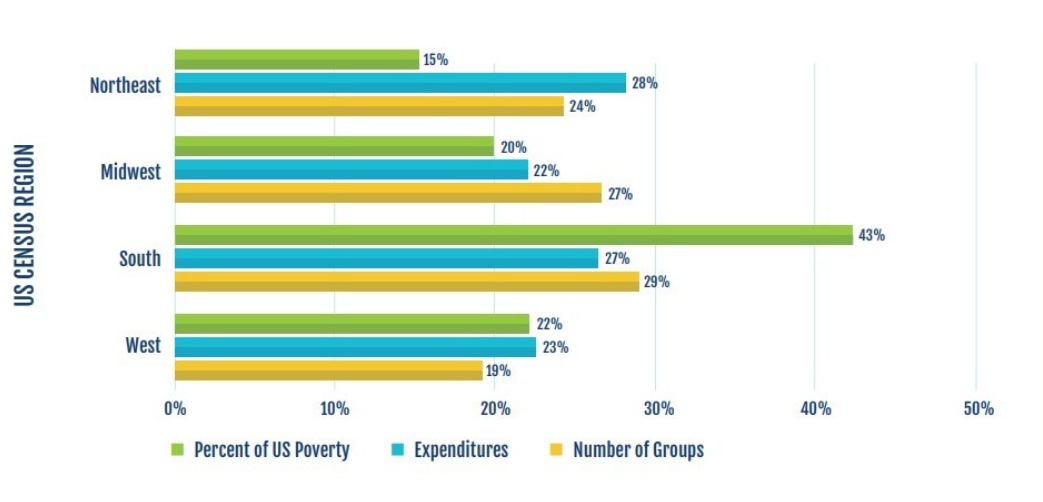
- Community development groups are most prevalent in the Northeast and less so in the South, relative to each region’s share of the national total of people living in poverty.
- Total revenues, government support, and assets are proportional to the number of community development groups in each region.
- Non-metropolitan-area groups’ spending matches the non-metro share of national poverty population.
- Non-metropolitan groups have fewer assets but more government support, relative to their share of the national total of people living in poverty.
- The rural community economic development sector is substantially more reliant on social services agencies than urban areas.
Community Development Organizations & Their Expenditures
Relative to Region's Poverty Population
The second report in the series, Tracing Community Economic Development Funding Flows, examines the funding infrastructure for community economic development groups.
|